The Benefit of the Throughput Score Report
- Obtain valuable insights by monitoring the specific day and time when containers typically are being used. This will enable you to gain a comprehensive understanding of the fill level patterns and trends, allowing for more effective planning
- Log into your Superfy Account
Upon logging into the platform, you will be automatically taken to the Collections module. Otherwise, navigate to the Collections module located on the top left-hand side of the screen.
-
- Select Reports and from the drop-down menu, select Insights

- Select Fill Level Trend from the list of report menu.

Within this report, users can filter by;
- Zones
- Zone Groups
- Asset Tags
- Asset Types
- Date/Time
- Assets
- Sensors
Click on the Submit Filter button when using any of the above filters.

To obtain meaningful and valuable insights, it is recommended to filter the data by selecting a specific asset, zone and date range. Alternatively, click on the pre-set Intervals.

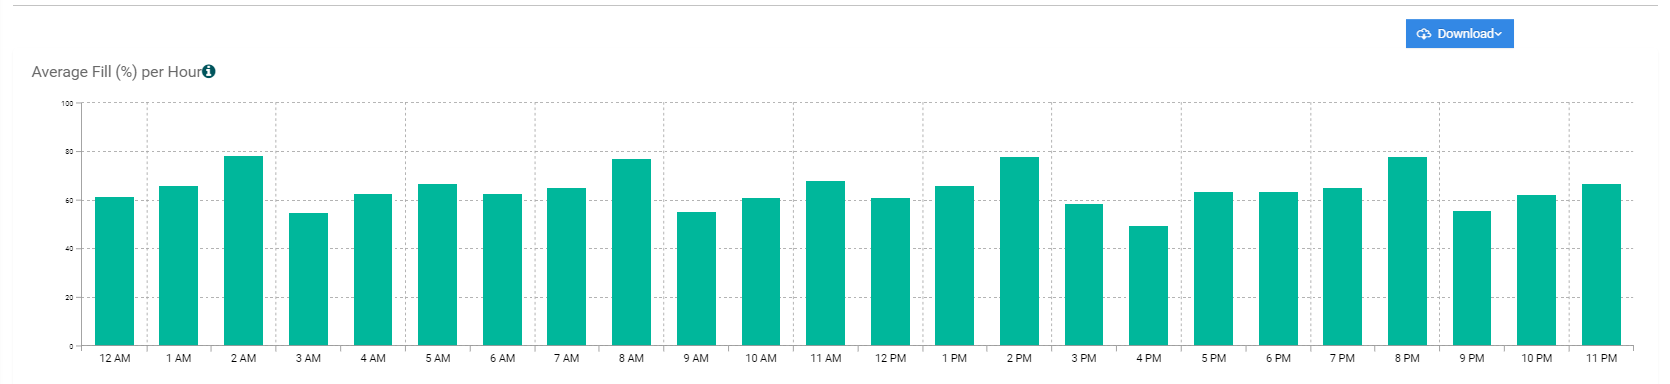
The Average Fill (%) per Hour graph shows the average fill level per hour for selected assets within a selected time range.
The Average Fill (%) per Day graph shows the daily average fill level for selected assets within a selected date range.

Hover your cursor over the graph for a snapshot of the information. You can also zoom in and out by using your mouse scroll wheel.

Click on Download located above the graph to export the report to excel or PDF.